Check on the piplanning server side
1 Check it the PI-Server is seeing any POST requests from JIRA at all
| Code Block |
|---|
docker ps # Get ID of the nginx docker container docker logs -f <container-ID> |
Now check if you see a POST request in the nginx container log.
Check if the network allows POST requests form the JIRA server to the piplanning server
2 Check if you can issue e curl POST request from the Jira to the PI-Planningserver server
| Code Block |
|---|
curl -d "test=1" -X POST http://pi-hostnameORip/jira-endpoint |
...
3 Cloud: Check if certificate is valid. Do you have specified the full-chain certificate or only the certificate?
Check on the JIRA side
1 Check if webhook is triggered in Jira
...
| Info |
|---|
The location of the log depends on your configuration. By default you will find it (Linux) /opt/atlassian/jira/logs/catalina.log |
4 Check if webhook add-on (and all modules) is activated in JIRA
- Admin->Add-ons->Manage add-ons
- Search for Webhook in System
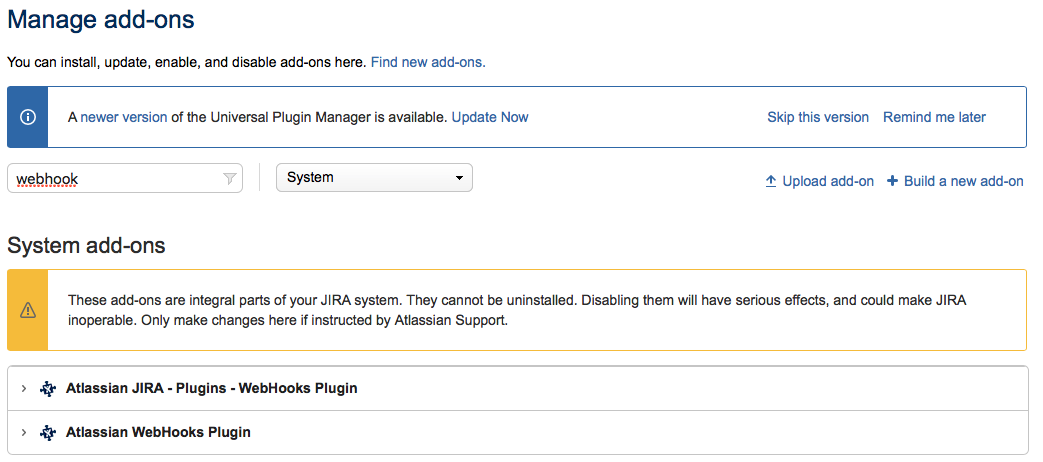
- Check if all modules in the listed plugins are enabled
5 Send us your JIRA logs (maybe we are able to see some misconfiguration in there)
- Admin->System→Troubleshooting and support tools→Create support.zip