in piplanning.io you can show these metrics:
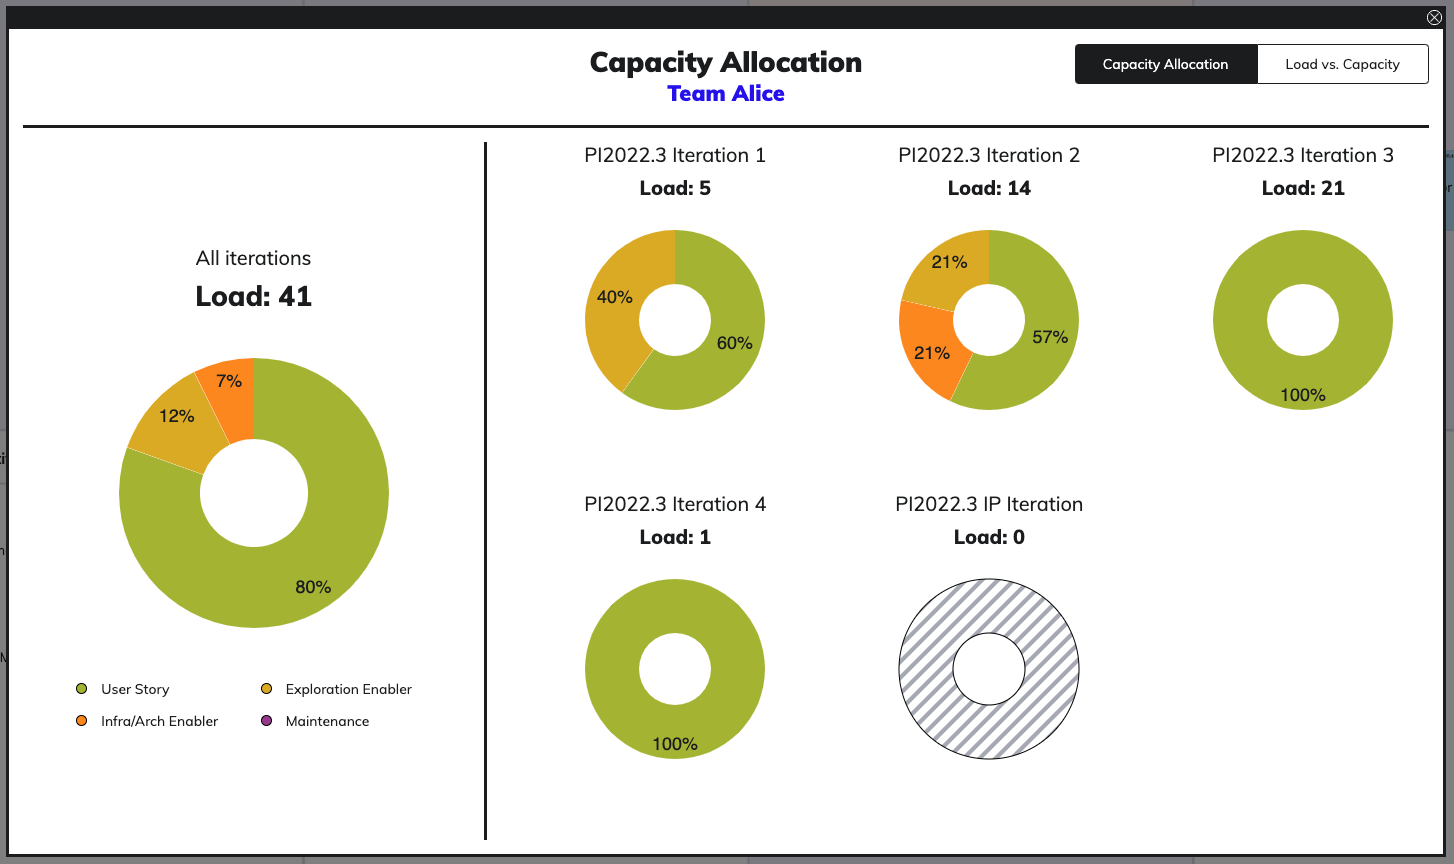
Capacity Allocation
Load vs. Capacity
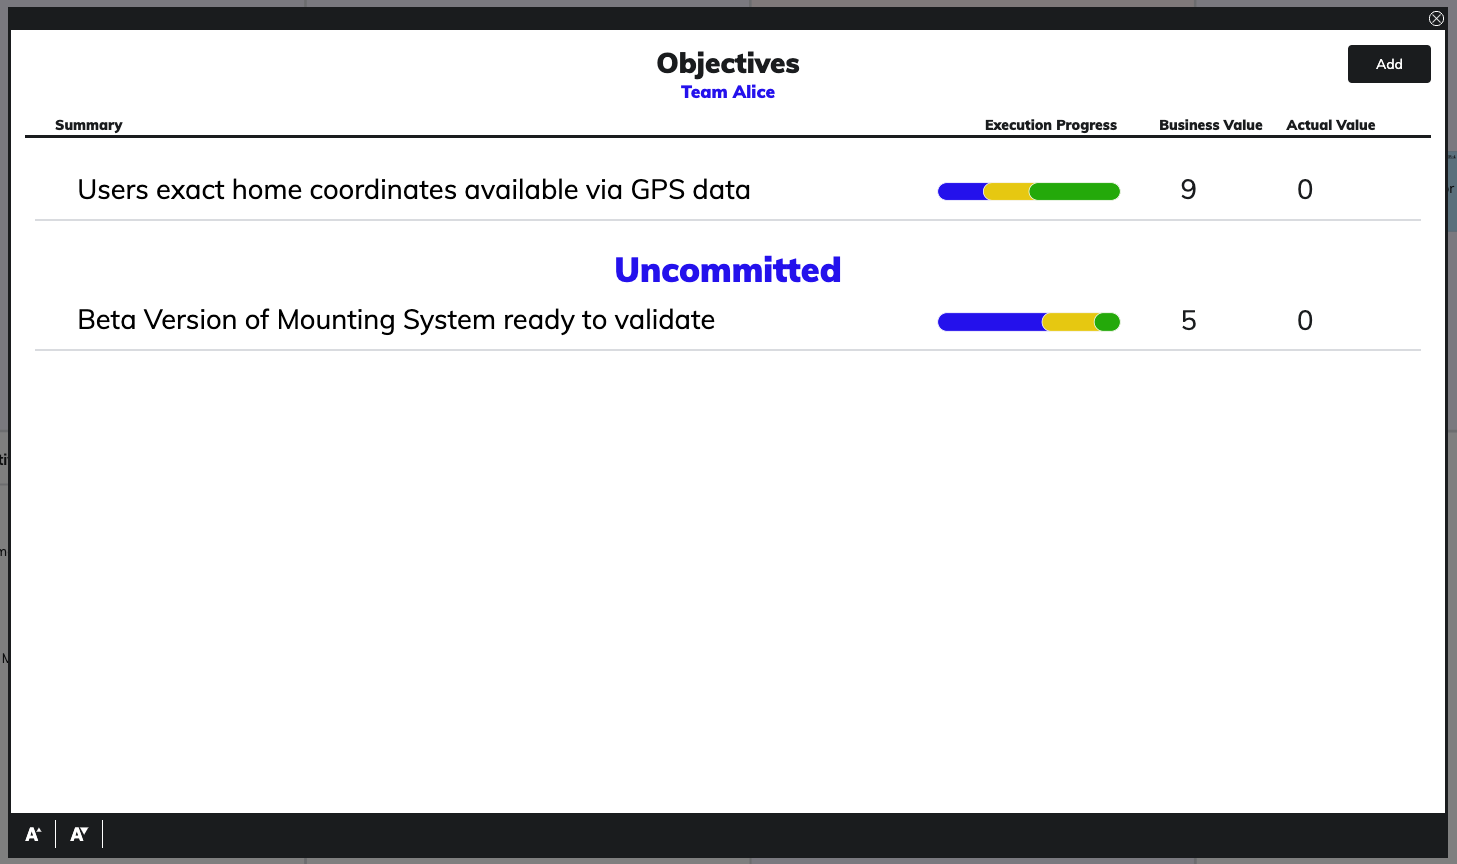
Progress on Objectives
Show metrics
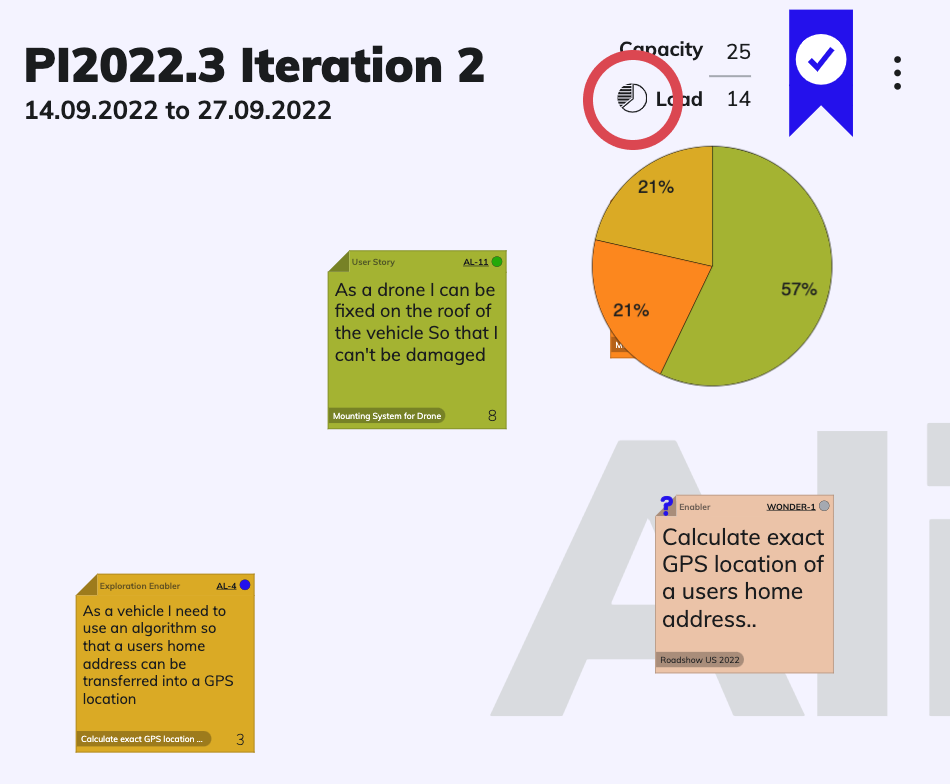
Click on the pie chart icon next to the Load on Team Boards
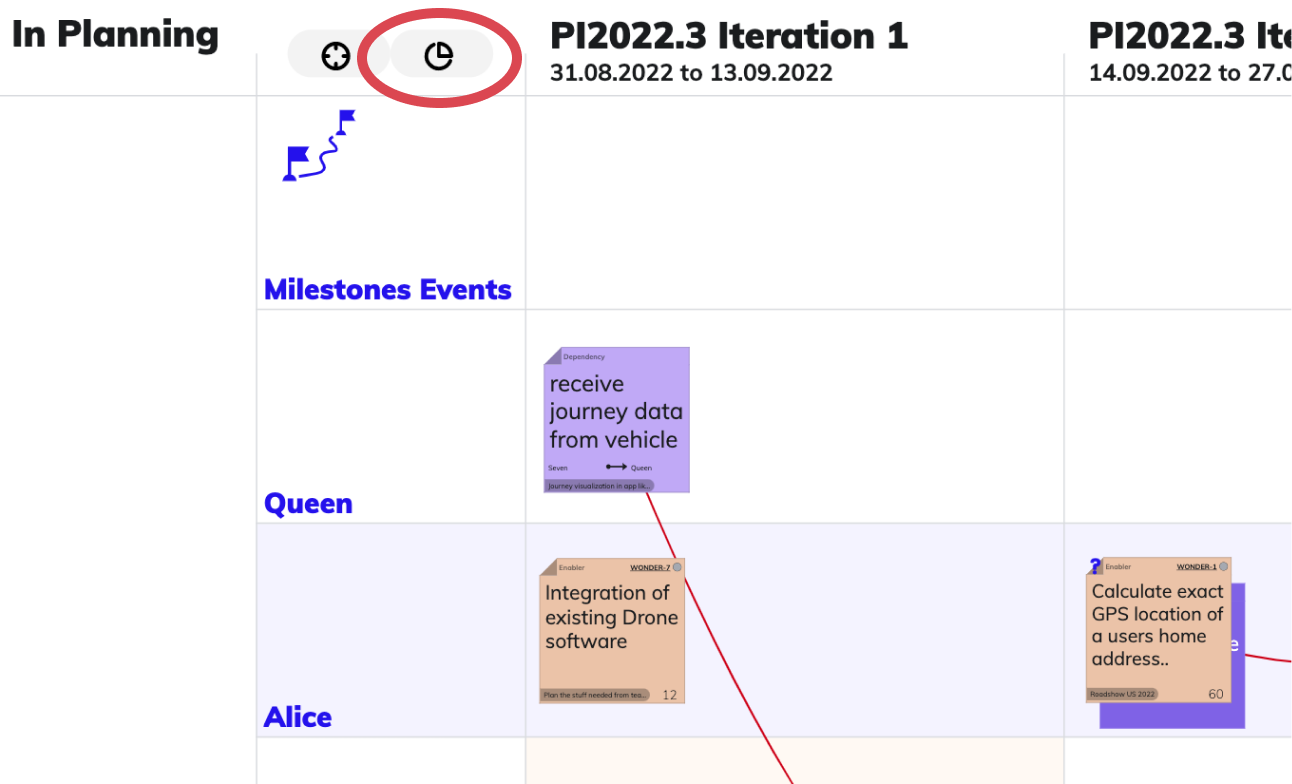
Click on the “Program Metrics” Button on the Program Board
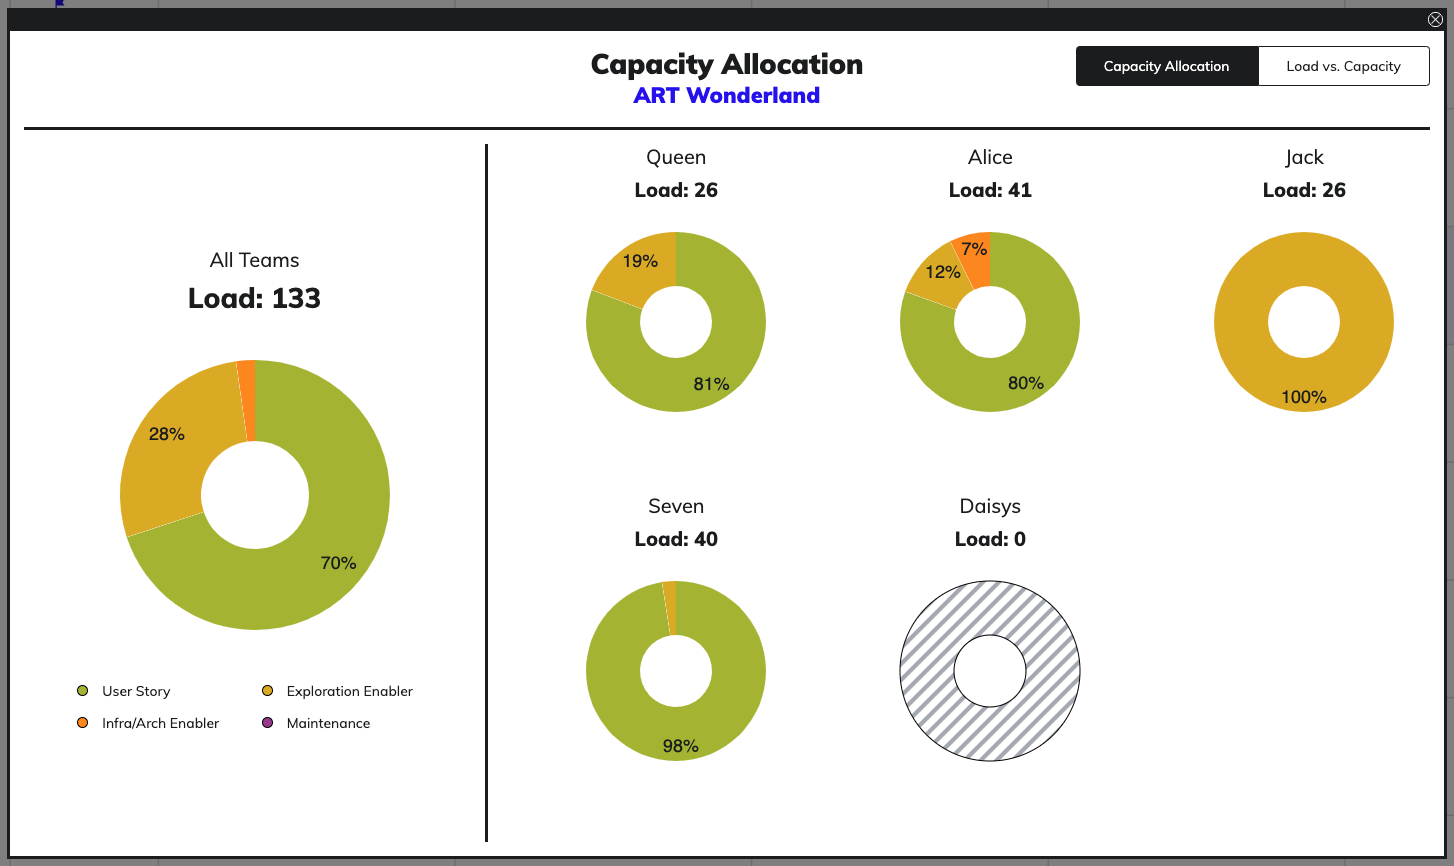
Capacity Allocation
On Team Board
On Program Board
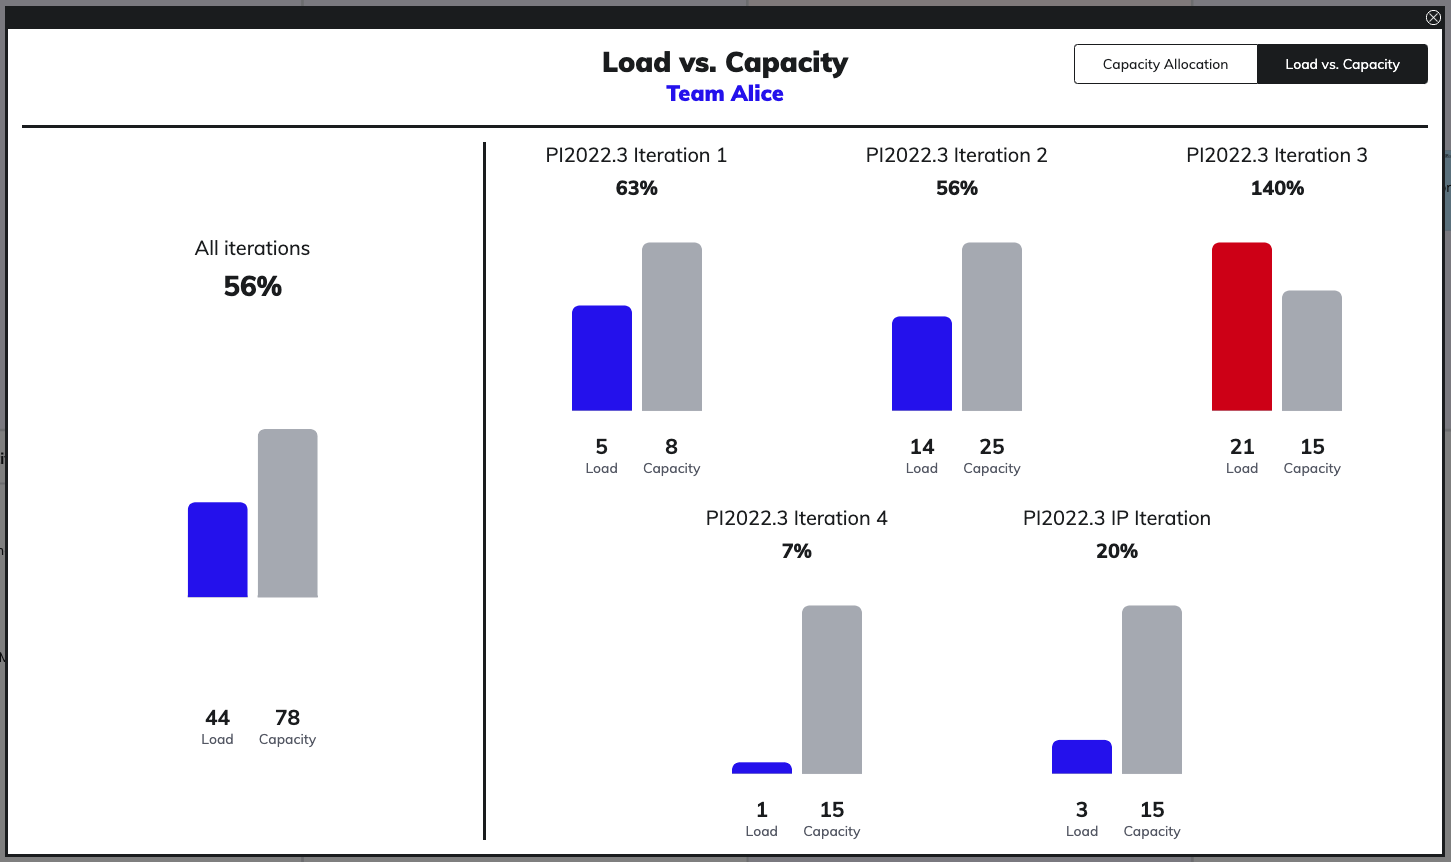
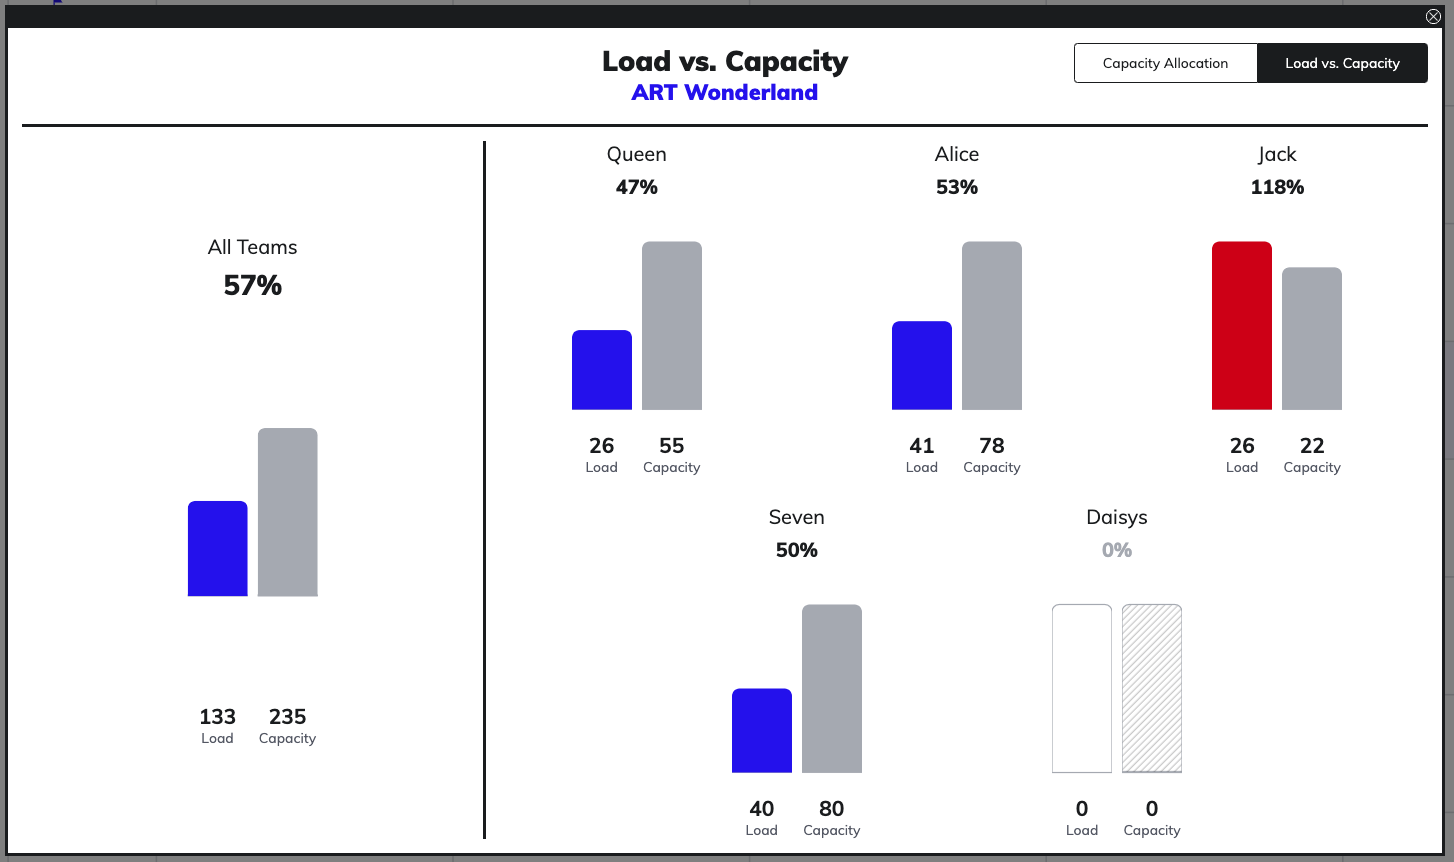
Load vs. Capacity
On Team Board
On Program Board
Progress on Objectives
Based on linking work items to objectives and the work item status, progress is visualized on objectives