2.8.0 Debug Webhooks
Check on the piplanning server side
1 Check it the PI-Server is seeing any POST requests from JIRA at all
docker ps   # Get ID of the nginx docker container
docker logs -f <container-ID>
Now check if you see a POST request in the nginx container log. Requests from Jira normally have the following structure:
XXX.XXX.XXX.XXX - - [06/May/2020:07:18:46 +0000] "POST /jira-endpoint/XXXXXX?user_id=XXX&user_key=XXX HTTP/1.1" 200 0 "-" "Atlassian Webhook HTTP Client" "-"
Check if the network allows POST requests form the JIRA server to the piplanning server
2 Check if you can issue e curl POST request from the Jira to the PI-Planningserver server
curl -d "test=1" -X POST http://pi-hostnameORip/jira-endpoint
Check the logs of the nginx container if you see a POST request.
3 Cloud: Check if certificate is valid. Do you have specified the full-chain certificate or only the certificate?
Check on the JIRA side
1 Check if webhook is triggered in Jira
Summary:
- In Jira: go to Admin --> System --> Logging and Profiling
- Click: Configure logging level for another package
- Add com.atlassian.webhooks.plugin.PublishTaskFactoryImpl and set it to debug
This will only log an entry when the webhook has been triggered, so if you don't see any entries, the webhook is not triggering.
You should see some entry like:
AO_4AEACD_WEBHOOK_DAO {ID = 1} 55838
<Possible warning / errors from Jira will appear here>
The location of the log depends on your configuration. By default you will find it (Linux) /opt/atlassian/jira/logs/catalina.log
2. Check if webhook queue is full
Set the appropriate logging level in Jira (com.atlassian.webhooks).
Watch out for entries in the logs of the following format:
XXXX-XX-XX XX:XX:XX,XXX-XXXX https-jsse-nio-8443-exec-278 url: /rest/greenhopper/1.0/sprint/<ID>/start; user: <user-id> WARN <user-id> <id> n8qvx1 <IP>,<IP> <trigger-event> [c.a.webhooks.plugin.WebHookPublisherImpl] Executor rejected the web hook 'PublishTask{listenerKey=com.atlassian.webhooks.api.register.listener.WebHookListener@2a5116c5, uri=<webhook-url>, body={<webhook-body>} rejected from java.util.concurrent.ThreadPoolExecutor@40453c55[Running, pool size = 3, active threads = 3, queued tasks = 100, completed tasks = 1000002]'
Explanation:
Jira has an internal queue (size=100). This queue gets processed by a HTTP client with a worker-pool (threads) of 3 (https://jira.atlassian.com/browse/JRASERVER-70950, https://bitbucket.org/atlassian/atlassian-webhooks-plugin/src/atlassian-webhooks-3.3.0/plugin/src/main/java/com/atlassian/webhooks/plugin/WebHookPublisherImpl.java) If all these 3 connections are used, the queue starts to fill up. If a lot of events need to be processed the queue will reach the limit of 100. Any new request which can not make it into the queue will fail and result in the error above.
Resolution:
Try to limit the amount of webhooks setup in Jira. Try generate less webhooks it not only helps to delete / deactivate configured webhooks in Jira but also limit the scope whenever a webhook triggers by applying a strict JQL filter.
4 Check if webhook add-on (and all modules) is activated in JIRA
- Admin->Add-ons->Manage add-ons
- Search for Webhook in System
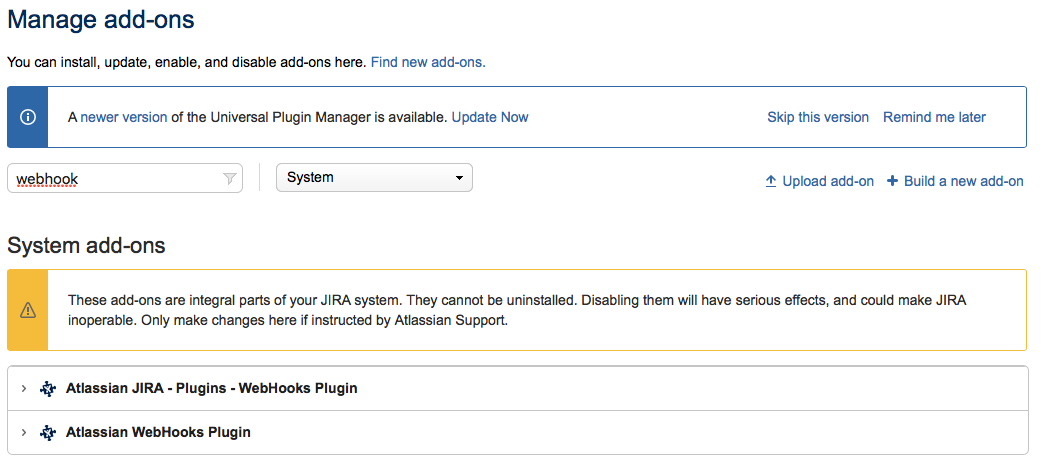
- Check if all modules in the listed plugins are enabled
5 Send us your JIRA logs (maybe we are able to see some misconfiguration in there)
- Admin->System→Troubleshooting and support tools→Create support.zip