/
Ishikawa Diagram
Ishikawa Diagram
- Silvio (Unlicensed)
Owned by Silvio (Unlicensed)
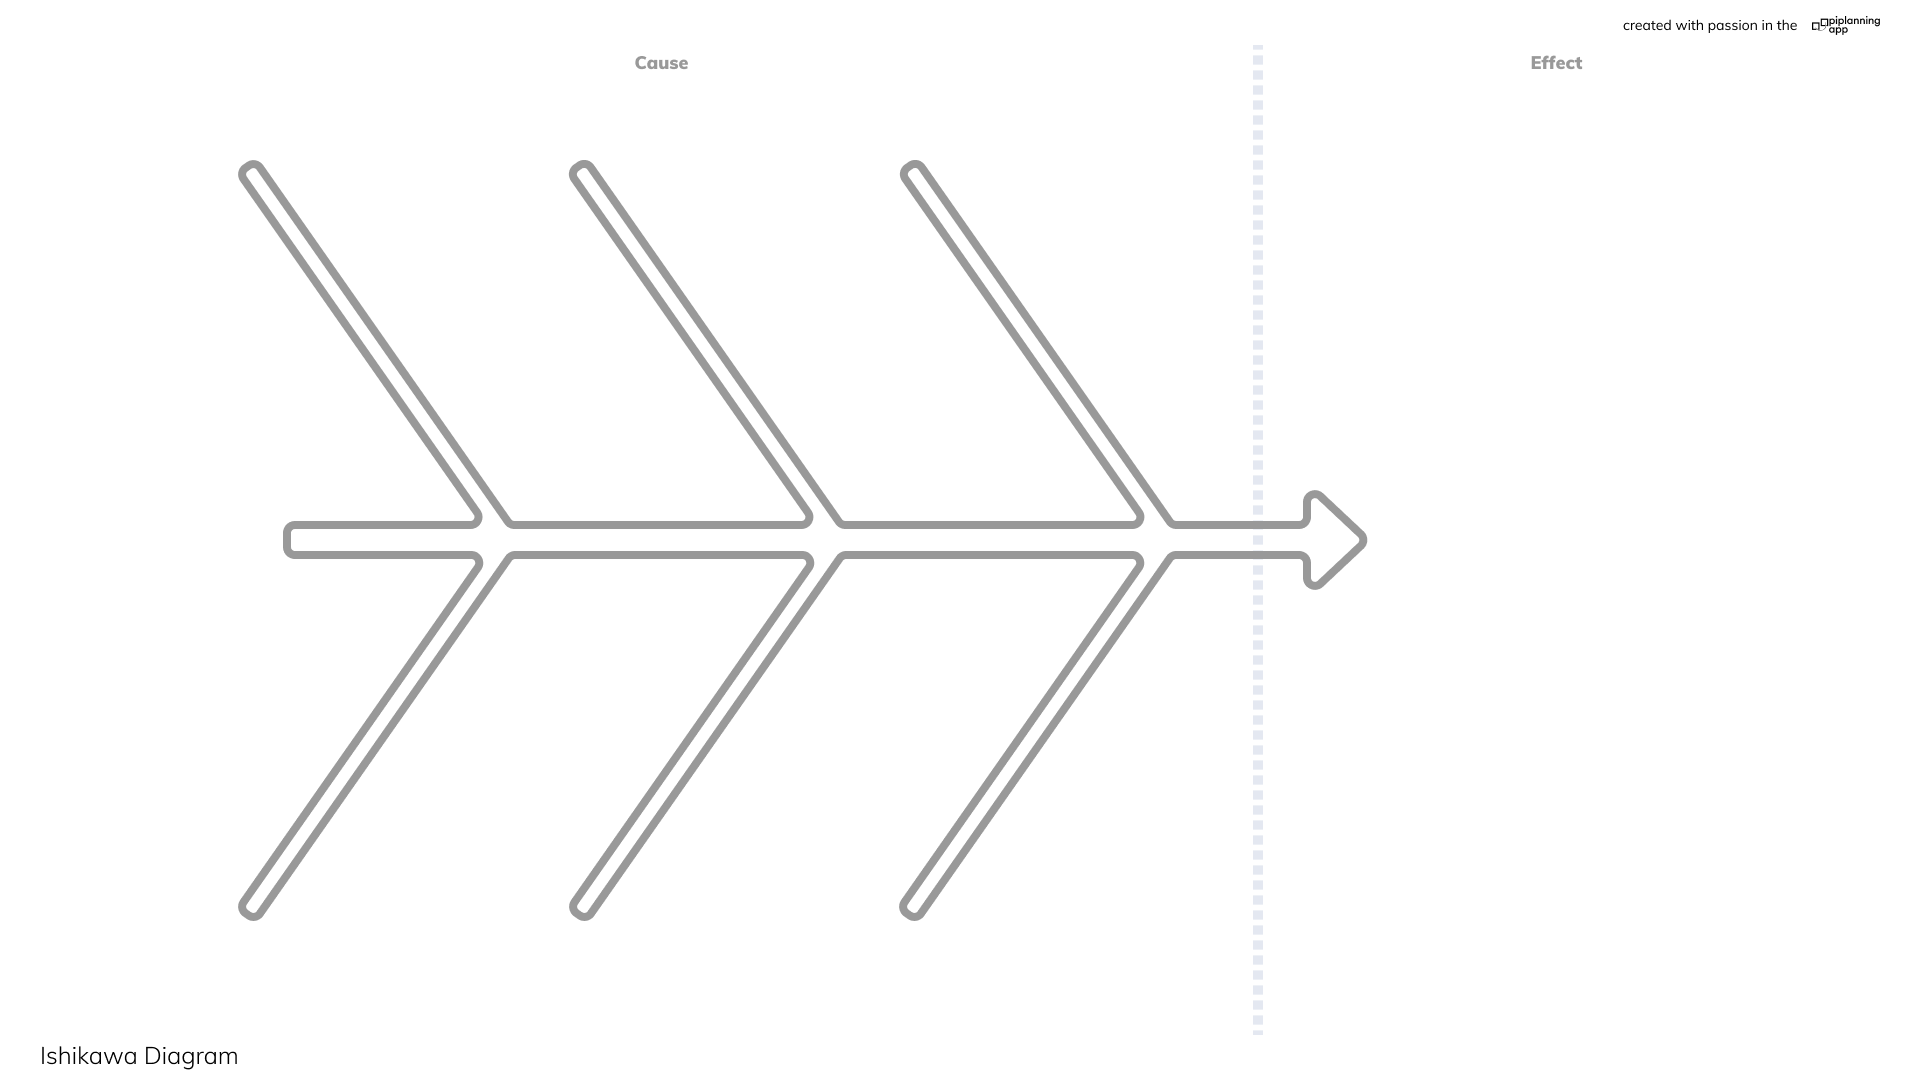
Ishikawa diagrams (also called fishbone diagrams, herringbone diagrams, cause-and-effect diagrams, or Fishikawa) are causal diagrams created by Kaoru Ishikawa that show the potential causes of a specific event.
Common uses of the Ishikawa diagram are product design and quality defect prevention to identify potential factors causing an overall effect. Each cause or reason for imperfection is a source of variation. Causes are usually grouped into major categories to identify and classify these sources of variation.
Advantages
- Highly visual brainstorming tool which can spark further examples of root causes
- Quickly identify if the root cause is found multiple times in the same or different causal tree
- Allows one to see all causes simultaneously
- Good visualization for presenting issues to stakeholders
Disadvantages
- Complex defects might yield a lot of causes which might become visually cluttering
- Interrelationships between causes are not easily identifiable
For more information refer to: https://en.wikipedia.org/wiki/Ishikawa_diagram
, multiple selections available,
Related content
Root-Cause Analysis
Root-Cause Analysis
More like this
Dependency / link warning
Dependency / link warning
More like this
Value Stream Canvas
Value Stream Canvas
More like this
Cost of Delay x Effort Matrix (WSJF)
Cost of Delay x Effort Matrix (WSJF)
More like this
V2.15.0
V2.15.0
More like this